Durability
In a previous essay, I wrote about the potential for de-globalization relative to burgeoning global interest rate policies and the larger macro environment.The New York Times recently published Why It Seems Everything We Knew About the Global Economy Is No Longer True.
The current moment presents an interesting case for economies of all sizes to decentralize and look inward. This does not necessarily mean economies will stop trading or even trade less. There is no doubt that trade makes the world better; autarky is simply bad for business. But this does mean there is potential for the flows of trade to flip for many small economies, and it is a long game. In addition to interest rates, there are many factors that could bring about more decentralized economies, including household consumption.
In this essay, I want to focus on US consumer spending and how its trends could impact the way investors make decisions and allocate capital. Many communities in the United States (and abroad) could take advantage of this to expand investment opportunities, increase the flow of capital in their own neighborhoods, and give everyday people a more direct involvement in the economic development of their own communities.
When we look at public US Government data, we see that since 1970 proportional consumption shifted from goods to services. The most recent data shows that 67% of today’s consumption is on services, and the rest is on durable and nondurable goods.
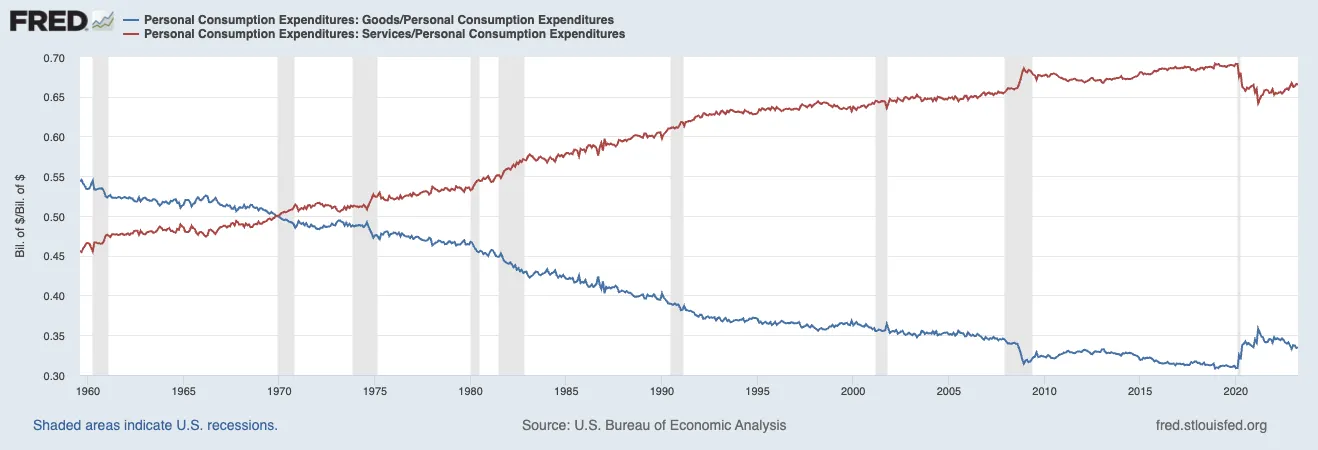
So US consumption is largely service-driven.
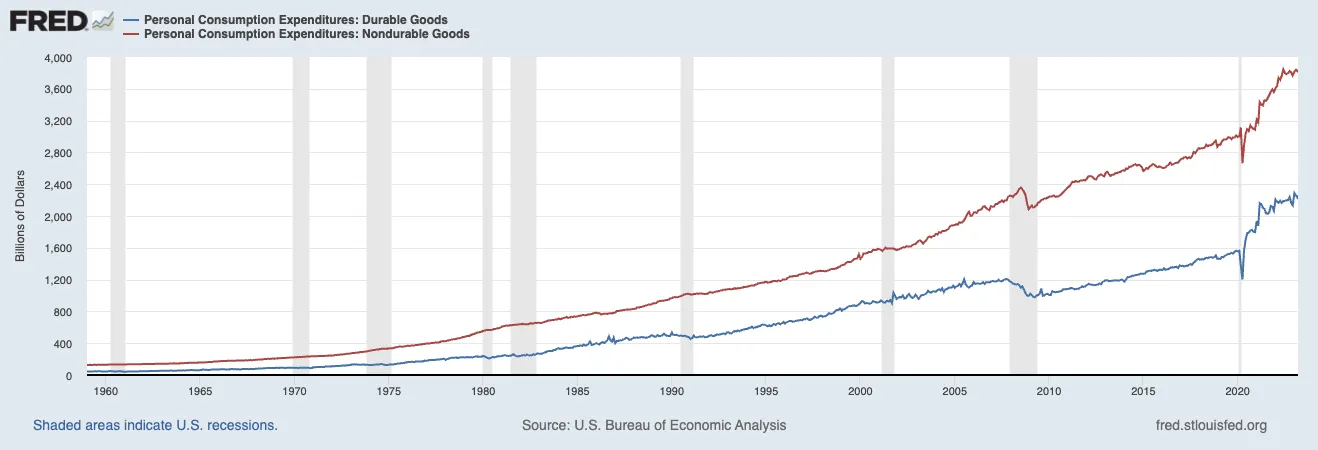
With goods, we see that nondurable goods account for the larger share of consumption. This makes sense - people need food and clothing more than they need cars or jewelry.
We also see that during recent periods of economic recession (gray bars), reductions in goods consumption decrease more drastically than they did in historical periods (1970, 1973, 1991). In April 2023, 63% of the consumption of goods was on nondurables (food, paper, clothing). Nondurables have generally accounted for 60-70% of goods consumption since the early 1980s.
With this in mind, a dive into [the shallow end] of the data pool shows that the absolute consumption gap between the two types of goods is widening. It is doing so exponentially. Inflation plays a role here, but so do other factors.
Let’s get a little technical for a moment.
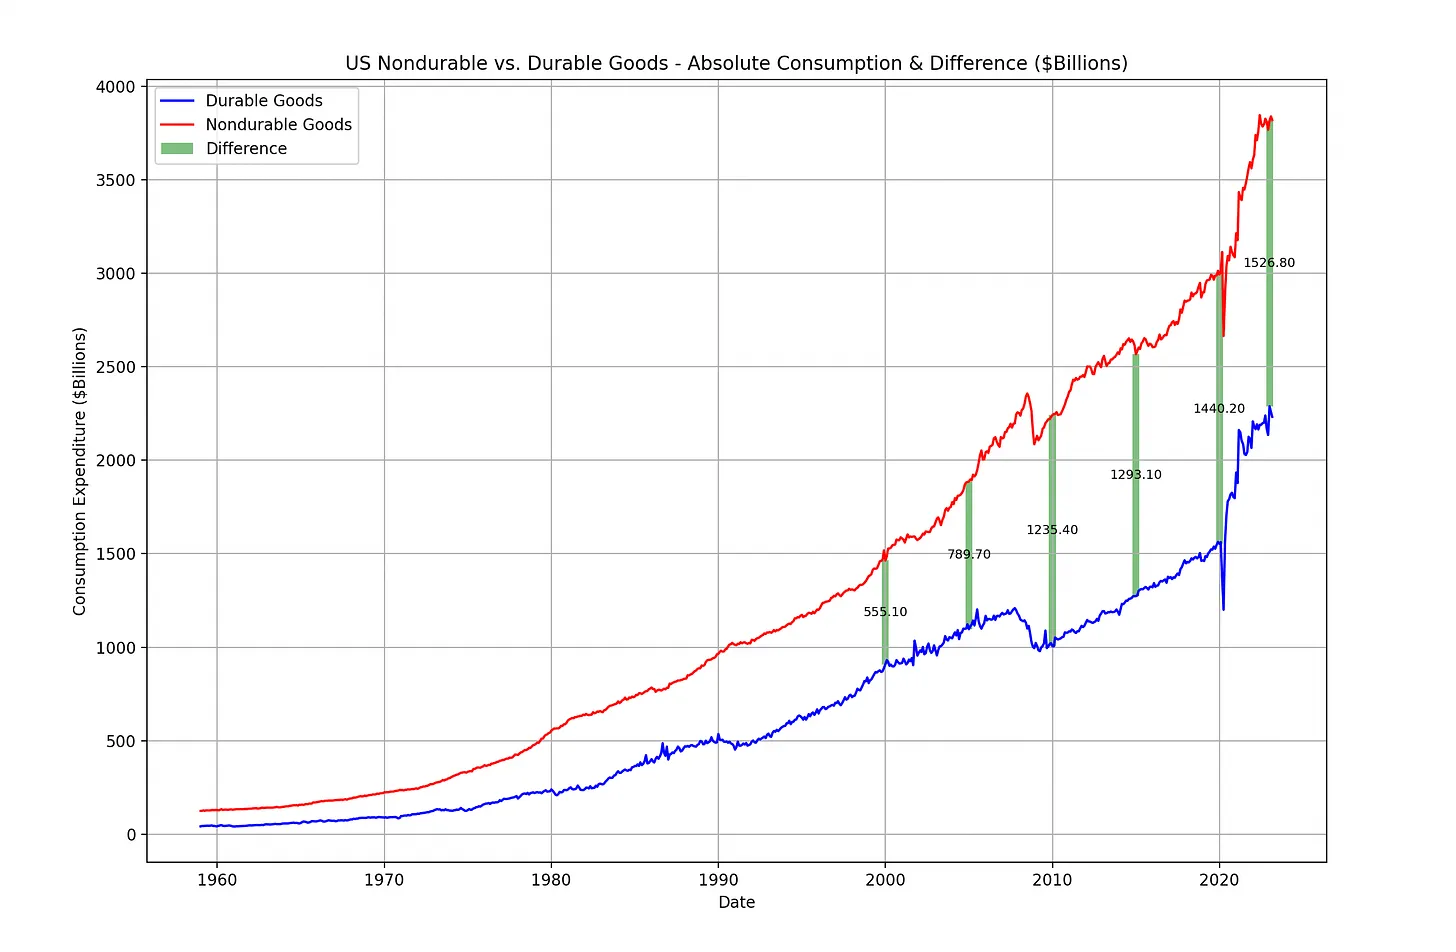
I put together the below graph with monthly absolute goods consumption highlighted approximately every 5 years between January 2000 and January 2023. We see a nondurables gap of $555B in 2000 that has grown to $1.5T in 2023. This means that in January 2023 Americans spent $1.5T more on nondurables than durables. We cannot ignore how inflation has driven the absolute costs of goods up. This does not hide the fact that consumption on goods is vastly driven towards nondurables versus durables, and that gap is widening at a significant rate.
Looking at the charts, you do not need to be a genius to see the trend. However, the proof is in the pudding. So let’s apply a basic model to statistically fit the difference.
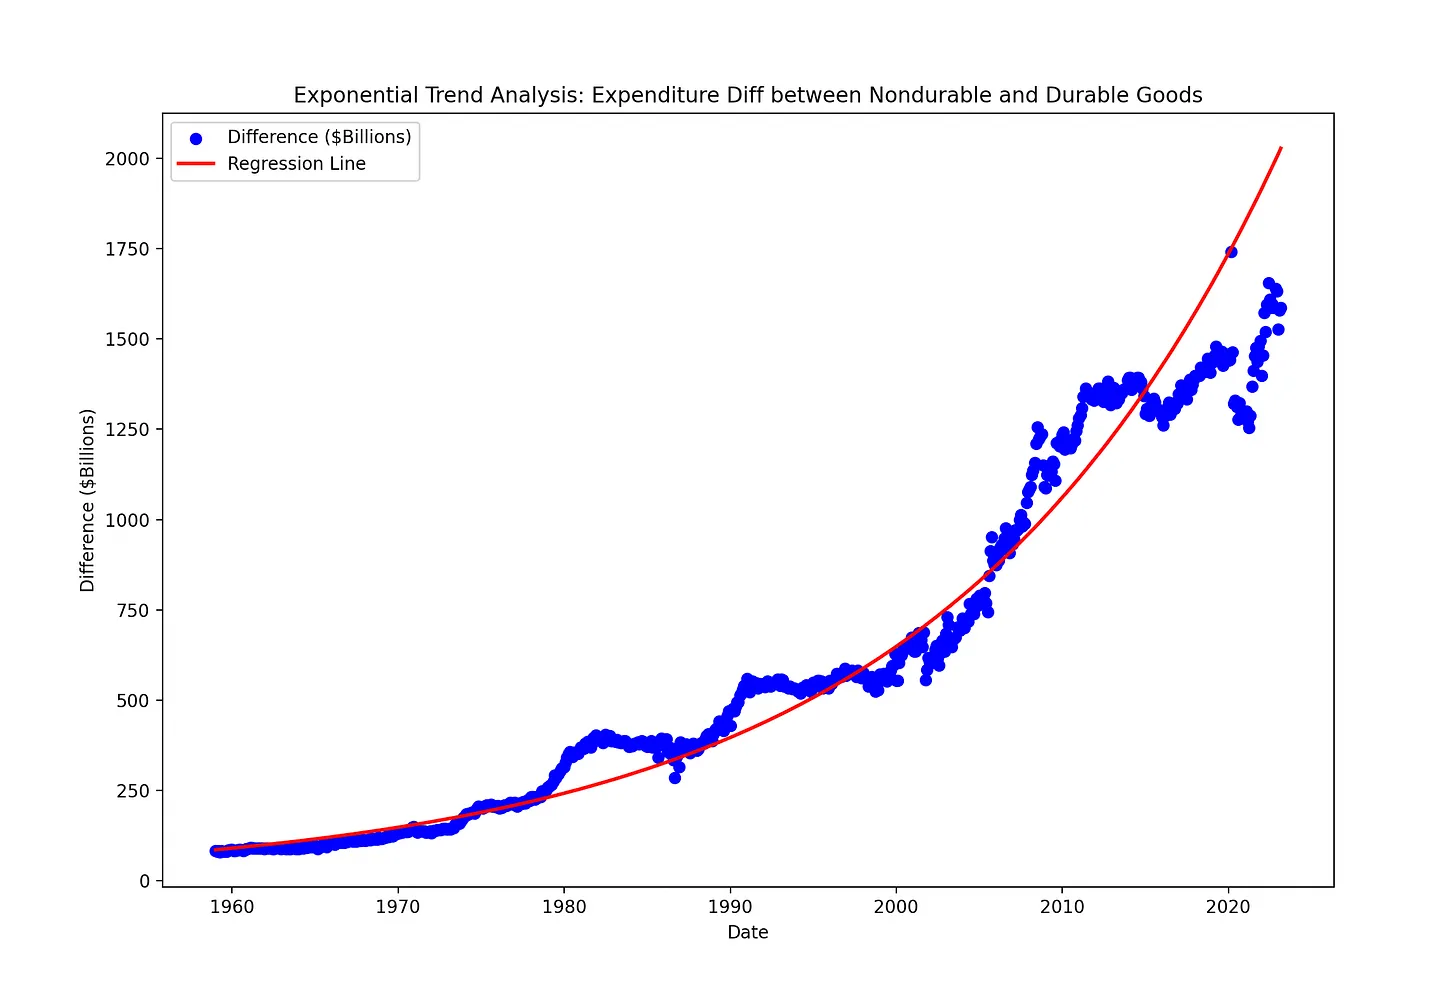
The consumption gap between nondurables and durables is growing exponentially. If you’re curious about the technical details, please see the footnotes1. Honestly, you don’t need stats to see the trend, but I needed a stats refresher. Badly.
The above chart plots an exponential regression on the absolute difference between nondurables and durables (the green lines from the prior chart, but for every month, not just 5 year increments). The red line is the exponential regression curve - giving us a clear indication that the gap is widening at an exponential rate.
The crazy part is that we are not even into the vertical part of the exponential model (later stages of exponential growth where the growth rate becomes extremely fast).
Translating this - American consumers are spending more on nondurables at an exponentially increasing rate. Based on this quick model, I expect that rate of consumption to increase even more significantly in the future. While inflation does play a key role in this, the growth of the US economy; is also a contributing factor. Whether or not you believe those who claim inflation is transitory is your decision as an investor.
But amongst this, there are derivations we can make on future investment opportunities. These derivations are influenced by technological innovation, rising income inequality, improvements in legislation and capital access, and a globalized system that was fueled by artificially cheap debt.
Derivations? Americans are spending increasingly more and more of their incomes on food, clothing, and other items that they throw away within a few years (or days) of purchasing. Unlike cars or jewelry, these items tend to be mass produced at low margin and low marginal cost. This consumption is more environmentally intensive, and has the highest potential to be productized closest to its final destination.
While it is important to acknowledge that inflation has driven some of the exponential growth in the cost of goods, there is a deeper opportunity at play. Economists like Michael Shuman see the consumption of nondurables and services as strong reasoning for why more and more communities should be localizing their production of these goods and services.
While certain factors like geography may make this difficult for certain communities, there is a growing trend to produce more nondurables and services closer to home, rather than importing them from the outside. We have seen evidence of this with the success of “grow local” and “buy local” movements.
What about the “invest local” movement? This is a fairly nascent idea, with the exception of some rare cases.
While some regulatory changes like Regulation D and the JOBS Act have made investing “locally” much more possible today, most investors are frankly unaware of ways that they could put more of their capital to work in their own zip code. This means that everyday people have never had a better opportunity to play a role in funding businesses and initiatives they believe their community needs to thrive. At the same time, many entrepreneurs do not have enough access to the capital they need. Regional banking is more brittle than ever. And when entrepreneurs do receive capital, it generally comes as an import from outside their community.
If everyday retail investors had more mechanisms to invest in nondurables and services closer to home, that would give their own communities more exports, tourism, vibrancy, and resilience. This would help their communities become more durable to economic shock and circulate significant financial and social capital. This kind of rising tide lifts all boats.
Better technology plays a role in facilitating these mechanisms.
Closing thoughts
So most consumer spending is on services, and 60%+ of the remaining goods expenditure is on nondurables. Both services and nondurables are the types of products that have the highest potential to be manufactured close to home. Most interesting to me is what this means about the business landscape and where significant opportunity lies for capital flows and new business creation.
With the exception of extremely remote geographies or demographics, communities with a diverse ecosystem of businesses focused on nondurables and services have a much higher chance of economic vibrance than those without. Everyday people have a tremendous opportunity to play a significant role in the economic development of their own communities (and profit from it), they just don’t have an efficient means of doing so nor an awareness that this is even possible. This is the exact conviction that led me to found my first two businesses, Flatspell and Scout.
There has never been a better opportunity for more local capital to flow into local businesses, more competitive businesses to be created closer to home, create more democratized access to improved capital flows, and more diversified returns on investment for investors.
Anyone should have the opportunity to be a financial shareholder in their own community. We can all play a role in making our communities better, both with and without capital allocation.
While I don’t have all the answers, I am curious to see how meaty this one is.
Footnotes
-
I applied each of a OLS linear regression, OLS exponential regression, and seasonal ARIMA model to fit the difference. Exponential regression plotted the cleanest and yielded the least confusing results to interpret (R-squared 0.970, AIC -600). When analyzing the residuals - I saw a periodic divergence from 0 approximately every 10 years, indicating some level of seasonality. Astute observers will argue the need to study temporal autocorrelation. I attempted an ARIMA to examine this but it fit too perfectly to me and is harder to interpret for general use cases. I do acknowledge this does leave room for deeper analysis in the future. Looking at the scatterplot on the exponential regression, I believe the observations below the regression line in recent periods are caused by the spending pattern changes from the pandemic, however these are already shifting back towards prior behavior from the most recent data. ↩